

Dr Matt Rigby, Reader in Atmospheric Chemistry, University of Bristol
How much greenhouse gas is emitted by any individual country? With global emissions of carbon dioxide hitting a record of 36.8 billion tonnes this year, and delegates gathering in Madrid for the latest UN climate talks, it’s a pressing question.
One might assume that we know precisely how much is emitted by any given country, and that such figures are rigorously cross-checked and scrutinised. And in some respects, this is true – countries are required to report their emissions to the UN, based on exhaustive guidelines and with reams of supporting data.
Yet these reports are based on what are known as inventory (or “bottom-up”) methods. To simplify, this means that governments figure out how much greenhouse gas is emitted by a typical car, cow, or coal plant, and then add up all the cows, cars and so on to get an overall emissions figure.
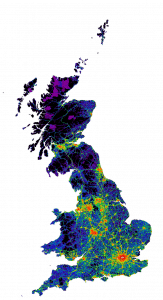
Map showing the UK’s CO2 emissions, calculated using ‘bottom-up’ methods. Daniel Hoare, University of Bristol, © Crown 2019 copyright Defra & BEIS, Author provided.
While this method is essential to understand the make-up of a country’s emissions, it is ultimately reliant on accurate and comprehensive information on economic activity, some compromises to allow standardisation across countries, and some element of trust.
And such reporting can go awry. In 2018 and again earlier this year, colleagues and I made headlines when we first identified mystery emissions of a banned ozone-depleting substance and greenhouse gas and then later tracked its source down to factories in eastern China.
The problem is that these “bottom-up” emissions reports do not generally include what some might consider key information: measurements that can indicate the actual amount of greenhouse gas in the atmosphere.
So could new data help us better understand how much we are emitting?
A national greenhouse gas monitoring network
The UK, Switzerland and Australia have pioneered a measurement-based approach to add credibility and transparency to their emissions reports. In 2012, a network of measurement stations was established on telecommunications towers across the UK to sniff out greenhouse gases emitted from around the country.
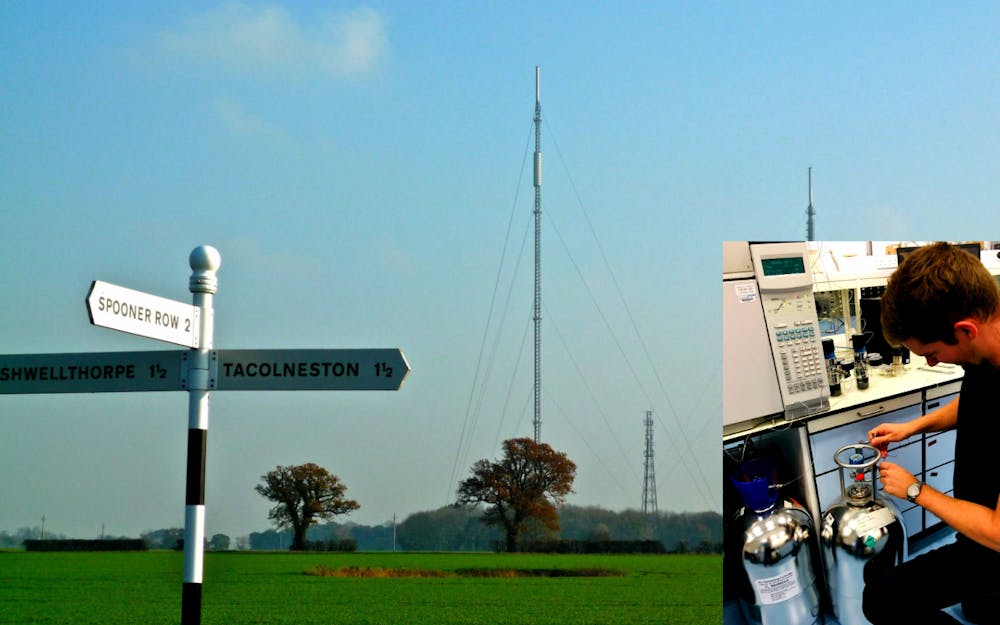
A tower used to sample the greenhouse gases in the air in Norfolk, England. Inset: a researcher working on the project. University of Bristol, Author provided
To interpret these measurements, we use sophisticated computer models that simulate how gases are transported from the surface, through the atmosphere, to the points where they are observed. By comparing the modelled and measured concentrations, we can determine the national emission rate.
These “top-down” estimates, which now form a key part of the UK’s National Inventory Report to the UN, have yielded some surprising insights. Sceptics may suspect that governments would be keen to “hide” emissions from the rest of the world, but in at least one case atmospheric data suggests that the UK has for years actually over-estimated, by around 100%, emissions of a potent greenhouse gas used in car air conditioners (HFC-134a). In contrast, for the major greenhouse gases methane and nitrous oxide, the data in recent years corroborates the UK inventory reports remarkably well.
More questions than answers?
Naturally, once this measurement data is available, new questions emerge. For example, the UK inventory suggests that methane emissions have gradually declined since 1990 but the atmospheric data suggests little trend, if any. This is important, because the UK benchmarks its emissions reductions against the year 1990.
Could this suggest that the country has not been as successful as it thought at reducing methane leaked from landfills, for example? Or have such emissions reductions been offset by some other source? Unfortunately, such questions are difficult to answer using “standard” atmospheric measurement techniques – a molecule of methane emitted from a landfill looks very similar to one from a cow.
Very similar, that is, but not identical. I am involved in a new £3m project called DARE-UK (Detection and Attribution of Regional Emissions in the UK), which looks for tell-tale features that can help us identify where carbon dioxide, methane and nitrous oxide in the atmosphere came from.
One type of signal that we are looking for is a tiny perturbation to the ratio of heavy and light isotopes of methane and carbon dioxide in the air. Isotopes are almost identical to one another but differ in their molecular mass. It turns out that cow burps, for example, emit methane with less of the heavy isotope than similar amounts of methane from a leaky gas boiler. So, we hope that this type of data may help the UK’s inventory team identify which sectors of the bottom-up reports may require re-examination.
We need improved transparency
While these measurements are proving a valuable aid for inventory compilers, their main utility is likely to be in ensuring trust and transparency in the international reporting process. Atmospheric measurements do not suffer from the confidentiality issues that can prevent interested parties from peeking behind the scenes of national inventories.
Could governments still hide their emissions? It’s unlikely, provided top-down methods are used with open and transparent protocols and data sharing. This should avoid accusations of foul play that could threaten to derail initiatives like the international climate accord, the Paris Agreement.
The UK example shows this type of emissions evaluation is now ready for the international stage. Institutions such as the World Meteorological Organization are working with governments and sub-national stakeholders to try to make it happen. Hopefully policymakers will see the value of finding out what’s really being released into their air.
This article is republished from The Conversation under a Creative Commons license. Read the original article.