Dr. Stephanie von Hinke Kessler Scholder, Centre for Market and Public Organisation
Last month’s government-commissioned school food review showed that the nutritional quality of school food has improved substantially since 2005, when Jamie Oliver started its campaign to improve the nutritional value of school meals. Nevertheless, take-up of school meals remains low, at 43%. In other words, 57% of children are not eating school lunches, but bring a packed lunch, have snacks, or buy their food elsewhere. The report shows that the majority of these meals are unhealthy. In fact, in contrast to what most parents think, only 1% of packed lunches meet the nutritional standards.
In addition to affecting child health, there is substantial evidence that poor nutrition affects cognitive performance. Michèle Belot and Jonathan James show in their study that the Jamie Oliver campaign led to a significant increase in children’s test scores in primary schools (Key Stage 2), as well as a drop in authorised absences (i.e. those that are mostly linked to illness and health).
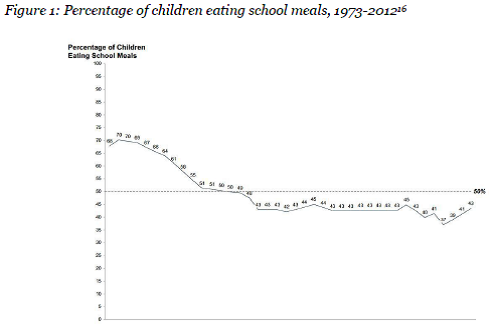
Figure 1 is taken from last month’s school food review (p.42), showing that school meal take-up dropped from around 70% in the early 1970s to just over 40% in the late 1980s. Why has this take-up declined so dramatically? The authors of the review argue that it may be partly driven by the rampant inflation of the mid-seventies, but also by the removal of the national fixed pricing of school meals.
In a recent study, I specifically focus on the latter: I investigate how two Acts of Parliament, introduced in the 1980s, affected school meal take-up in primary schools. Prior to 1980, schools had to provide free meals to all children in low-income families, whilst others paid a fixed price of 35p per day, set by the government. With the election of the Conservative administration in 1979, the government attitude to the service shifted. It was viewed as too expensive and the government wanted to introduce more choice and parental responsibility. Two reforms were introduced, which radically altered the school meal service.
The first, the 1980 Education Act, ended the fixed pricing of school meals, and abolished the minimum nutritional standards. Although schools were still obliged to provide free lunches to those eligible for free meals (i.e. those in low-income families), they could now set the price for all those not eligible. This caused a price increase of around 43%: the most common price in 1981 was 50p per day.
The main effect of the second reform, the 1988 Local Government Act, was a tightening of eligibility rules: children in families receiving Family Credit (FC) were no longer eligible for free meals, with only those on Income Support (IS) remaining eligible.
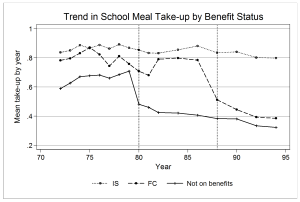
I evaluate whether households change their behaviour due to these reforms, and find evidence of a considerable household response. Rather than plotting the school meal take-up rates of all children, as in Figure 1, Figure 2 shows the trends in the take-up rates of school meals by whether the child was affected by the reforms. The solid line denotes those not on benefits (those affected by the 1980 Act). Prior to the 1980 Act, their school meal take-up rates remained relatively constant. With the introduction of the reforms in 1980, however, their take-up rates drop considerably, with little change among those not affected (the dashed and dotted lines).
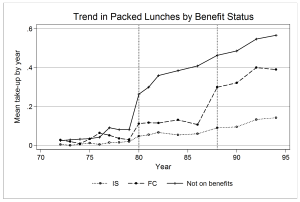
Figure 3 shows that this drop is compensated by an increase in the consumption of packed lunches.
Looking at the effects of the 1988 reform, the data show a very similar pattern. School meal take-up rates drop dramatically among those on FC (those affected by the 1988 reform), with no changes in the take-up rates among those not affected. Again, the drop in the take-up of school meals is compensated by an increase in the consumption of packed lunches.
Figure 2:
Figure 3:
To conclude, as suggested by the school food review, inflation may certainly have played a role in the downward trend in school meal take-up in the 1970s and 1980s. However, the analyses above show that exploring the trend in school meal take-up among all children may conceal potential differential trends between different subgroups of children. Indeed, distinguishing between those affected and those not affected by the reforms highlights clear differences in their response to government policy. It shows the extent to which households change their behaviour in response to such policies, suggesting that the reforms were an important cause of the decline in school meal take-up during the 1980s.
This blog was first posted on the Centre for Market and Public Organisation blog.


